FortiSIEM provides organizations with a comprehensive, holistic and scalable solution, from IoT to the Cloud, with patented analytics that are actionable to tightly manage network security, performance and compliance standards, all delivered through a single pane of glass view of the organization.
Connect FortiSIEM with Devo SOAR
Navigate to Automations > Integrations.
Search for FortiSIEM.
Click Details, then the + icon. Enter the required information in the following fields.
Label: Enter a connection name.
Reference Values: Define variables here to templatize integration connections and actions. For example, you can use https://www.{{hostname}}.com where, hostname is a variable defined in this input. For more information on how to add data, see 'Add Data' Input Type for Integrations.
Verify SSL: Select option to verify connecting server's SSL certificate (Default is Verify SSL Certificate).
Remote Agent: Run this integration using the Devo SOAR Remote Agent.
Server URL: Application server URL to connect to the FortiSIEM. Example: abc.abcd.net or 10.10.10.10
Domain: The domain used to connect to the FortiSIEM.
Server Port(Optional): Application server port to connect to the FortiSIEM (Default is 443).
Username: The username used to connect to the FortiSIEM.
Password: The password used to connect to the FortiSIEM.
After you've entered all the details, click Connect.
Actions for FortiSIEM
Execute Event Query
Execute event query and returns the incident attributes.
Input Field
Choose a connection that you have previously created and then fill in the necessary information in the following input fields to complete the connection.
Input Name | Description | Required |
|---|---|---|
Jinja Template for Query Column Name | Jinja-templated XML query containing the query parameters. Example for "Top FortiSIEM Events By Count". | Required |
<Reports> <Report baseline="" rsSync=""> <Name>Top FortiSIEM Events By Count</Name> <Description>Ranks the events by the number of times they have occurred in a given time period.</Description> <CustomerScope groupByEachCustomer="false"> </CustomerScope> <SelectClause> <AttrList>eventType,COUNT(*)</AttrList> </SelectClause> <OrderByClause> <AttrList>COUNT(*) DESC</AttrList> </OrderByClause> <PatternClause window="3600"> <SubPattern id="1164394" name="Filter_OVERALL_STATUS"> <GroupByAttr>eventType</GroupByAttr> </SubPattern> </PatternClause> <userRoles> <roles custId="0">1169250</roles> </userRoles> <SyncOrgs/> </Report> </Reports>
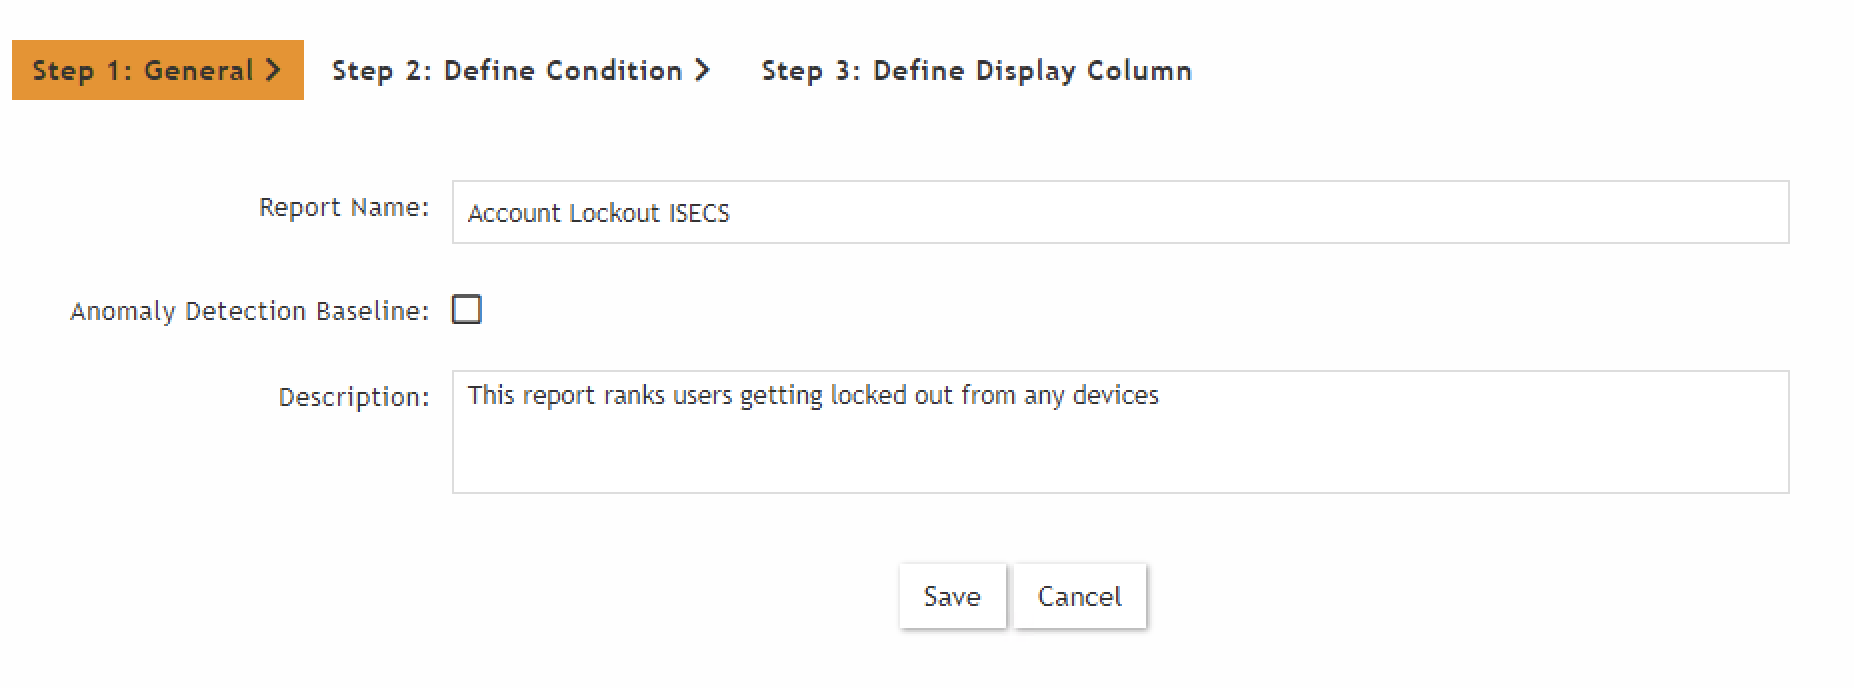
From UI
There is a three step wizard to generate query.
This gives the facility to save the query as report (XML) for later use. You can export the report and
copy the content.
Output
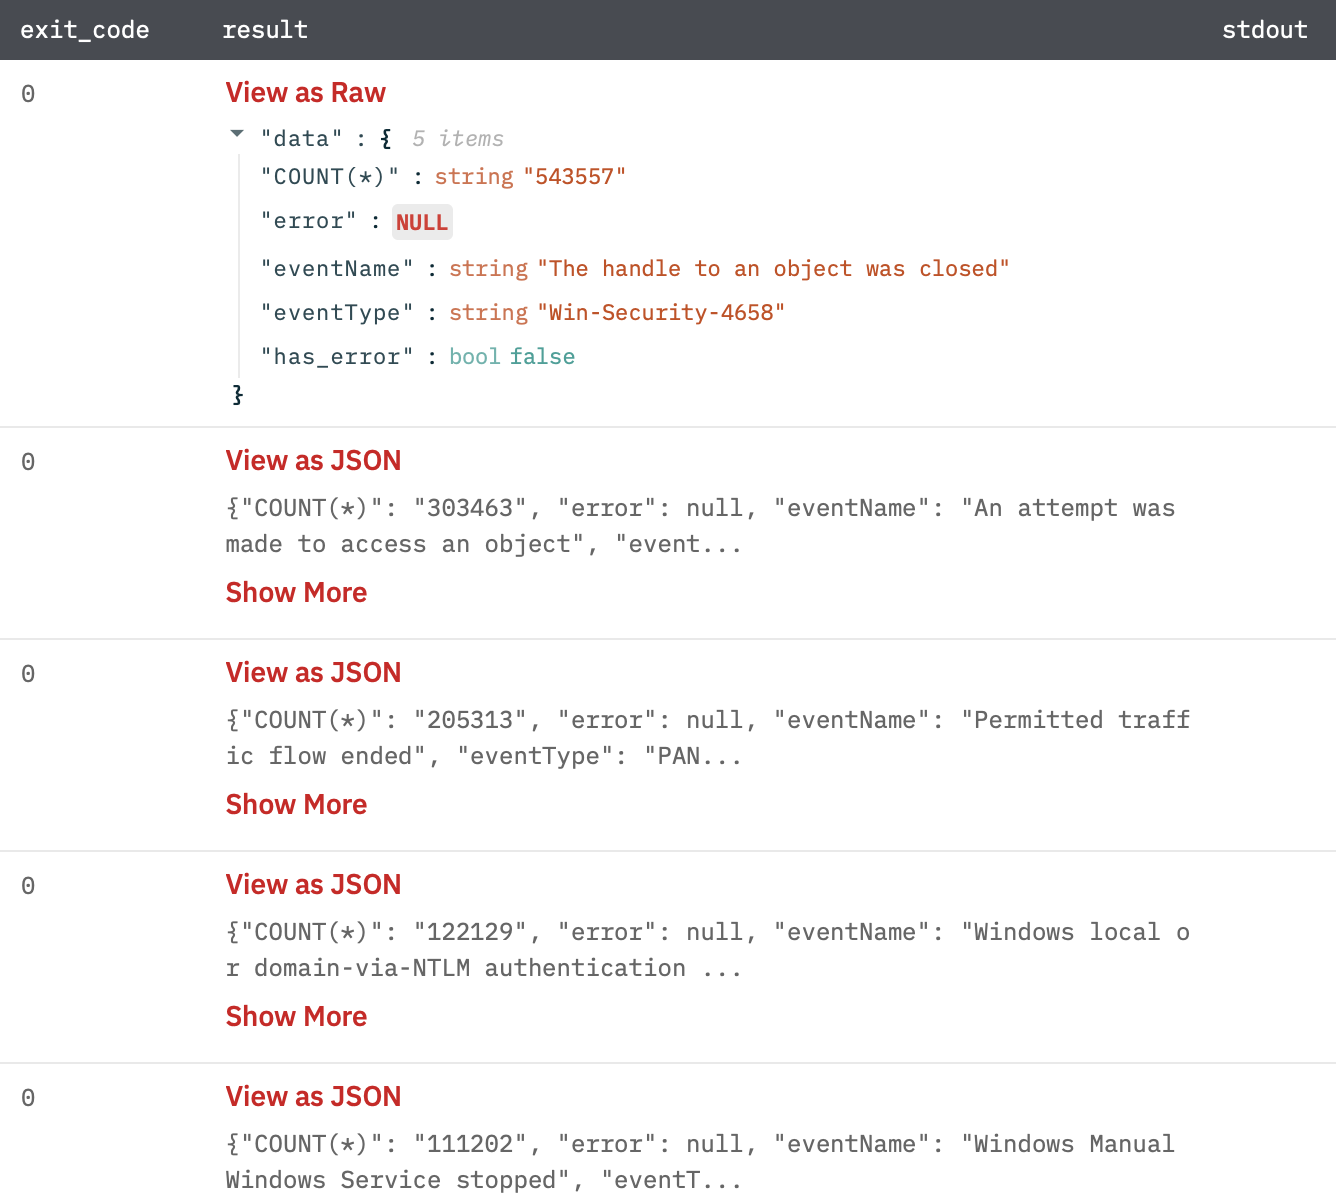
A JSON object containing multiple rows of result:
has_error: True/False
error: message/null
result: A JSON result against query.
Search Raw Data
Execute the search and retrieve raw data.
Input Field
Choose a connection that you have previously created and then fill in the necessary information in the following input fields to complete the connection.
Input Name | Description | Required |
|---|---|---|
Event Attribute | Jinja Template text containing the JSON payload of event attribute. Please enter either of the two, event attribute and CMDB attribute. | |
Example: {{event_attribute_column}}. | ||
CMDB attribute | Jinja Template text containing the JSON payload of CMDB attribute. Please enter either of the two, event attribute and CMDB attribute. | |
Example: {{cmdb_attribute_column}}. | ||
Limit | Limit number of raw data returned by FortiSIEM (Default is 100000 events). | |
Explode Results | Select whether to return separate rows for each result or a single row containing all results (Default is Separate Rows). |
Batch time in input
If we pass the value of key "timeTo" and "timeFrom" as null in JSON request payload for event attribute. It will take the batch time.
How to find eventFilters payload from the network tab.
Login on this example.com
Then click on Analytics.
Open the network tab and make the request as per the requirements of event attributes.
Open the run?notifyOpt file in the network tab and see the request payload.
Click on view source and copy the entire request payload.
How to find CMDB payload from the network tab.
Login on this example.com
Then click on Analytics.
Open the network tab and make the request as per the requirements of CMDB attributes.
Open the query file in the network tab and see the request payload.
Click on view source and copy the entire request payload.
Output
A JSON object containing multiple rows of result.
{json}{
   "Event Receive Time":1632909812000,
   "Raw Event Log":"<14>Sep 29 06:03:32 PA-Wired-Primary.wssu.edu 1,2021/09/29 06:03:31,013101008983,TRAFFIC,end,2305,2021/09/29 06:03:31,10.28.19.175,208.67.222.222,152.12.250.175,208.67.222.222,Rule_Trusted_To_Internet,,,dnscrypt,vsys1,trust,untrust,ethernet1/19,vlan.450,FortiSIEM,2021/09/29 06:03:31,34236848,1,64408,443,49245,443,0x40007a,udp,allow,648,238,410,2,2021/09/29 06:03:00,30,any,0,6971736255730240860,0x0,10.0.0.0-10.255.255.255,United States,0,1,1,aged-out,0,0,0,0,,PA-Wired-Primary,from-policy,,,0,,0,,N/A,0,0,0,0,9600294e-6dc4-4714-947e-0697e7f435a9,0,0,,,,,,,",
   "Event Type":"PAN-OS-TRAFFIC-end-allow",
   "has_error":false,
   "error":null,
   "custId":1,
   "extData":[
      {
         "left":"Time skew",
         "right":32
      },
      {
         "left":"Event Type",
         "right":"PAN-OS-TRAFFIC-end-allow"
      },
      {
         "left":"Event Rule Trigger",
         "right":1
      },
      {
         "left":"Event Severity",
         "right":1
      },
      {
         "left":"Total Bytes64",
         "right":648
      },
      {
         "left":"Event Action",
         "right":"0 (Permit)"
      },
      {
         "left":"Device Time",
         "right":1632909780000
      },
      {
         "left":"Post-NAT Source Country Code",
         "right":"US"
      },
      {
         "left":"Event Receive Time",
         "right":1632909812000
      },
      {
         "left":"Relaying IP",
         "right":"152.12.50.50"
      },
      {
         "left":"Reporting IP",
         "right":"152.12.50.50"
      },
      {
         "left":"Source User",
         "right":"russelljc"
      },
      {
         "left":"Reporting Device",
         "right":"PA-Wired-Primary.wssu.edu"
      },
      {
         "left":"Sent Bytes",
         "right":238
      },
      {
         "left":"Organization ID",
         "right":1
      },
      {
         "left":"Received Bytes",
         "right":410
      },
      {
         "left":"Duration",
         "right":30
      },
      {
         "left":"Event ID",
         "right":"6835901337248499309"
      },
      {
         "left":"System Event Category",
         "right":"4 (Traffic)"
      },
      {
         "left":"Count",
         "right":1
      },
      {
         "left":"Destination Country Code",
         "right":"US"
      },
      {
         "left":"Event Name",
         "right":"Permitted traffic flow ended"
      },
      {
         "left":"Event Parse Status",
         "right":1
      },
      {
         "left":"Connection Id",
         "right":"34236848"
      },
      {
         "left":"Event Severity Category",
         "right":"LOW"
      },
      {
         "left":"Reporting Country Code",
         "right":"US"
      },
      {
         "left":"Total Packets64",
         "right":2
      },
      {
         "left":"Reporting Vendor",
         "right":"Palo Alto"
      },
      {
         "left":"Reporting Model",
         "right":"PAN-OS"
      },
      {
         "left":"Organization Name",
         "right":"Super"
      },
      {
         "left":"User",
         "right":""
      },
      {
         "left":"Target User",
         "right":""
      },
      {
         "left":"Source User Full Name",
         "right":"Russell, James C."
      },
      {
         "left":"Application Name",
         "right":"dnscrypt"
      },
      {
         "left":"Virtual Host Name",
         "right":"vsys1"
      },
      {
         "left":"Total Flows",
         "right":1
      },
      {
         "left":"Session Id",
         "right":"0"
      },
      {
         "left":"IMEI Number",
         "right":""
      },
      {
         "left":"Flow End Reason",
         "right":0
      },
      {
         "left":"IMSI Number",
         "right":"0"
      },
      {
         "left":"Tunnel Protocol",
         "right":"N/A"
      },
      {
         "left":"Web Site Category",
         "right":"any"
      },
      {
         "left":"External Event Receive Protocol",
         "right":"Syslog"
      },
      {
         "left":"Post-NAT Source Country",
         "right":"United States"
      },
      {
         "left":"Source Host Name",
         "right":"HOST-10.28.19.175"
      },
      {
         "left":"Post-NAT Source State",
         "right":"North Carolina"
      },
      {
         "left":"Post-NAT Source City",
         "right":"Winston-Salem"
      },
      {
         "left":"Post-NAT Source Latitude",
         "right":"36.09986"
      },
      {
         "left":"Post-NAT Source Longitude",
         "right":"-80.24422"
      },
      {
         "left":"Source Firewall Zone",
         "right":"trust"
      },
      {
         "left":"Destination Firewall Zone",
         "right":"untrust"
      },
      {
         "left":"Source IP",
         "right":"10.28.19.175"
      },
      {
         "left":"Source Action",
         "right":"from-policy"
      },
      {
         "left":"Destination IP",
         "right":"208.67.222.222"
      },
      {
         "left":"Destination Host Name",
         "right":"HOST-208.67.222.222"
      },
      {
         "left":"Destination Country",
         "right":"United States"
      },
      {
         "left":"Post-NAT Source IP",
         "right":"152.12.250.175"
      },
      {
         "left":"Reporting Country",
         "right":"United States"
      },
      {
         "left":"Pre-NAT Destination IP",
         "right":"208.67.222.222"
      },
      {
         "left":"Collector ID",
         "right":1
      },
      {
         "left":"Destination State",
         "right":"California"
      },
      {
         "left":"Source MAC",
         "right":"18:66:da:17:d7:7a"
      },
      {
         "left":"Reporting State",
         "right":"North Carolina"
      },
      {
         "left":"IP Protocol",
         "right":"17 (UDP)"
      },
      {
         "left":"Destination City",
         "right":"San Francisco"
      },
      {
         "left":"Source TCP/UDP Port",
         "right":64408
      },
      {
         "left":"Reporting City",
         "right":"Winston-Salem"
      },
      {
         "left":"Destination TCP/UDP Port",
         "right":443
      },
      {
         "left":"Post-NAT Source Port",
         "right":49245
      },
      {
         "left":"Application Protocol",
         "right":"dnscrypt"
      },
      {
         "left":"Pre-NAT Destination Port",
         "right":443
      },
      {
         "left":"TCP flags",
         "right":"none"
      },
      {
         "left":"Event Parser Name",
         "right":"PaloAltoParser"
      },
      {
         "left":"Destination Latitude",
         "right":"37.77493"
      },
      {
         "left":"Reporting Latitude",
         "right":"36.09986"
      },
      {
         "left":"HTTP Connection Status",
         "right":"0"
      },
      {
         "left":"Source Interface Name",
         "right":"ethernet1/19"
      },
      {
         "left":"Firewall Rule",
         "right":"Rule_Trusted_To_Internet"
      },
      {
         "left":"Destination Longitude",
         "right":"-122.41942"
      },
      {
         "left":"Destination Interface Name",
         "right":"vlan.450"
      },
      {
         "left":"Palo Alto Firewall Action",
         "right":"allow"
      },
      {
         "left":"Reporting Longitude",
         "right":"-80.24422"
      }
   ],
   "Event Name":"Permitted traffic flow ended",
   "objectId":0,
   "aoSys":false,
   "naturalId":"6835901337248499309",
   "Reporting IP":"152.12.50.50",
   "parentId":null,
   "collectorId":null
}
Release Notes
v5.0.0- Updated architecture to support IO via filesystemv4.0.2- Bug fix to delete core dumps.


